The idea here is to use a weighted average of all of the last known values. A natural choice is to use a sequence of decaying weights and a geometric fits well in this case. We normalize the weights so that they sum upto 1.
This is because we are not considering any trend or seasonal components in our forecasts. Hence, the level is expected to remain constant. \(x\) is often referred to as level \(l\). This distinction will be useful when we work with trend and seasonality.
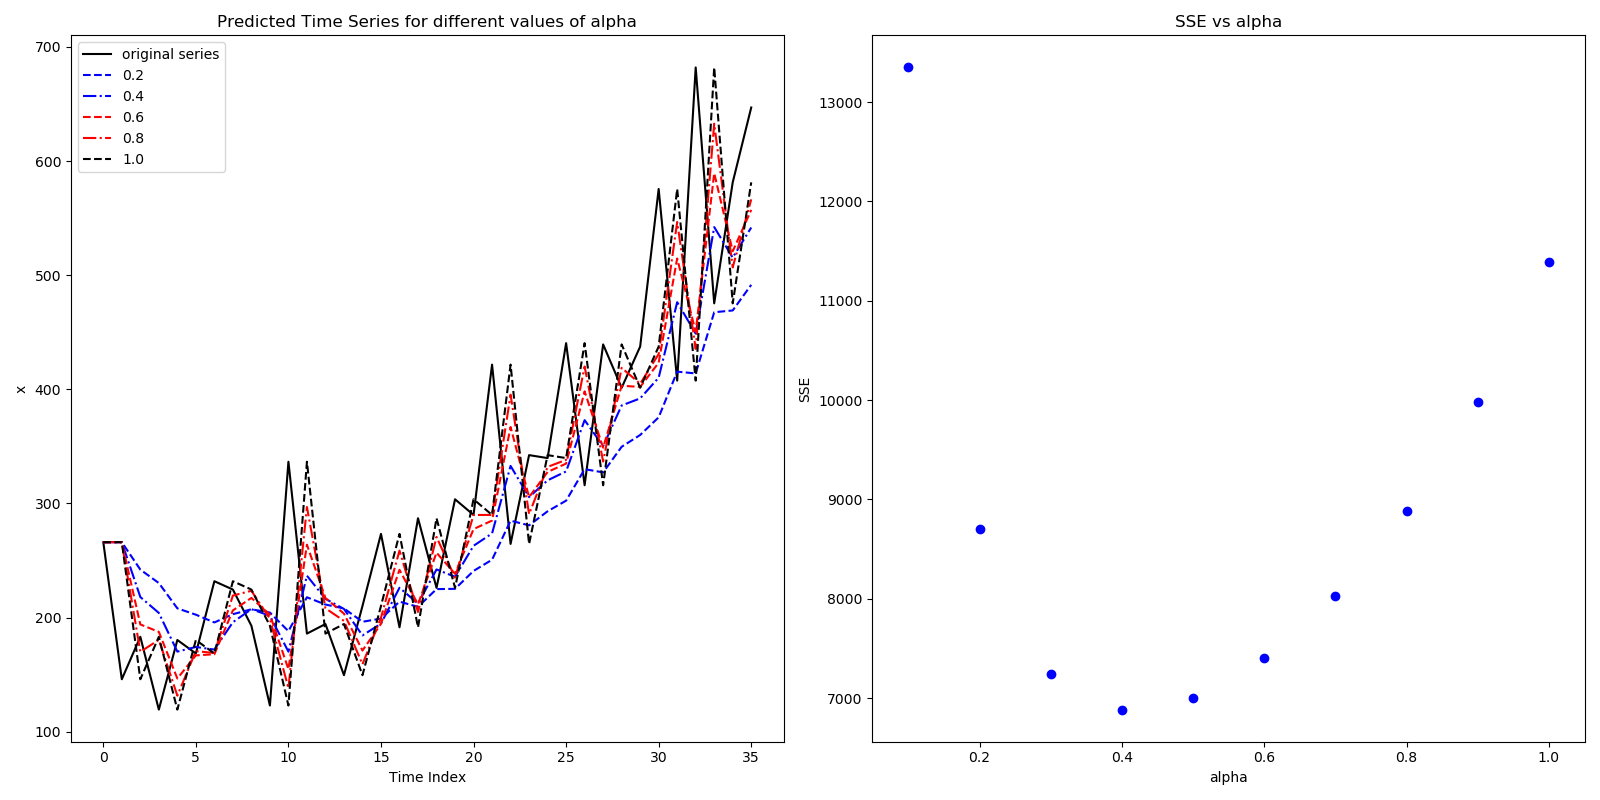
\(\alpha\) close to 1 will give higher weight to nearer observations and vice versa. To chose the optimal value of \(\alpha\), we will calculate the SSE for various combinations of \(\alpha \in [0,1]\) and choose the one with lowest SSE.
Figure below shows an example of how different \(\alpha\) affect the forecasted time series, and the changes in SSE with \(\alpha\).
Forecasted series as function of $\alpha$ on left, and SSE as a function of $\alpha$ on right for Simple Exponential Smoothing. Figures plot using ses.py